
Matomo for Product and App Analytics
This guide introduces product analytics capabilities available in Matomo, helping product teams understand user behaviour, improve usability, prioritise development, and measure the impact of product changes.
Modern digital products extend far beyond traditional websites with organisations managing mobile apps, SaaS platforms, customer portals, and authenticated applications that generate continuous user interactions across features, workflows, and business processes.
What is product analytics?
Product, engineering, UX, and business teams need visibility into how people use their applications over time.
Product analytics helps you understand how people use a digital product after they arrive. Unlike traditional website analytics, which often focuses on traffic acquisition and content performance, product analytics measures feature adoption, user journeys, onboarding, retention, and long-term engagement. These insights help product teams improve usability, prioritise development, and evaluate the impact of new features.
Collect product usage data
Product analytics starts with understanding how users move through an application and interact with its features. Matomo can collect this data using its JavaScript tracker, Android and iOS SDKs, server-side tracking, or the HTTP Tracking API, depending on how the product is built.
User interaction data helps you understand how people use your product, which features they adopt, where workflows slow down or fail, and how engagement changes over time. These insights help product teams identify friction, prioritise improvements, and measure the impact of product changes.
Combine app and website analytics
Many organisations operate multiple digital properties, including marketing websites, customer portals, SaaS products, and mobile applications.
Matomo can analyse activity across these environments within a single analytics platform. This can provide visibility into the complete user journey, from marketing website acquisition on a marketing website through to onboarding and product adoption.
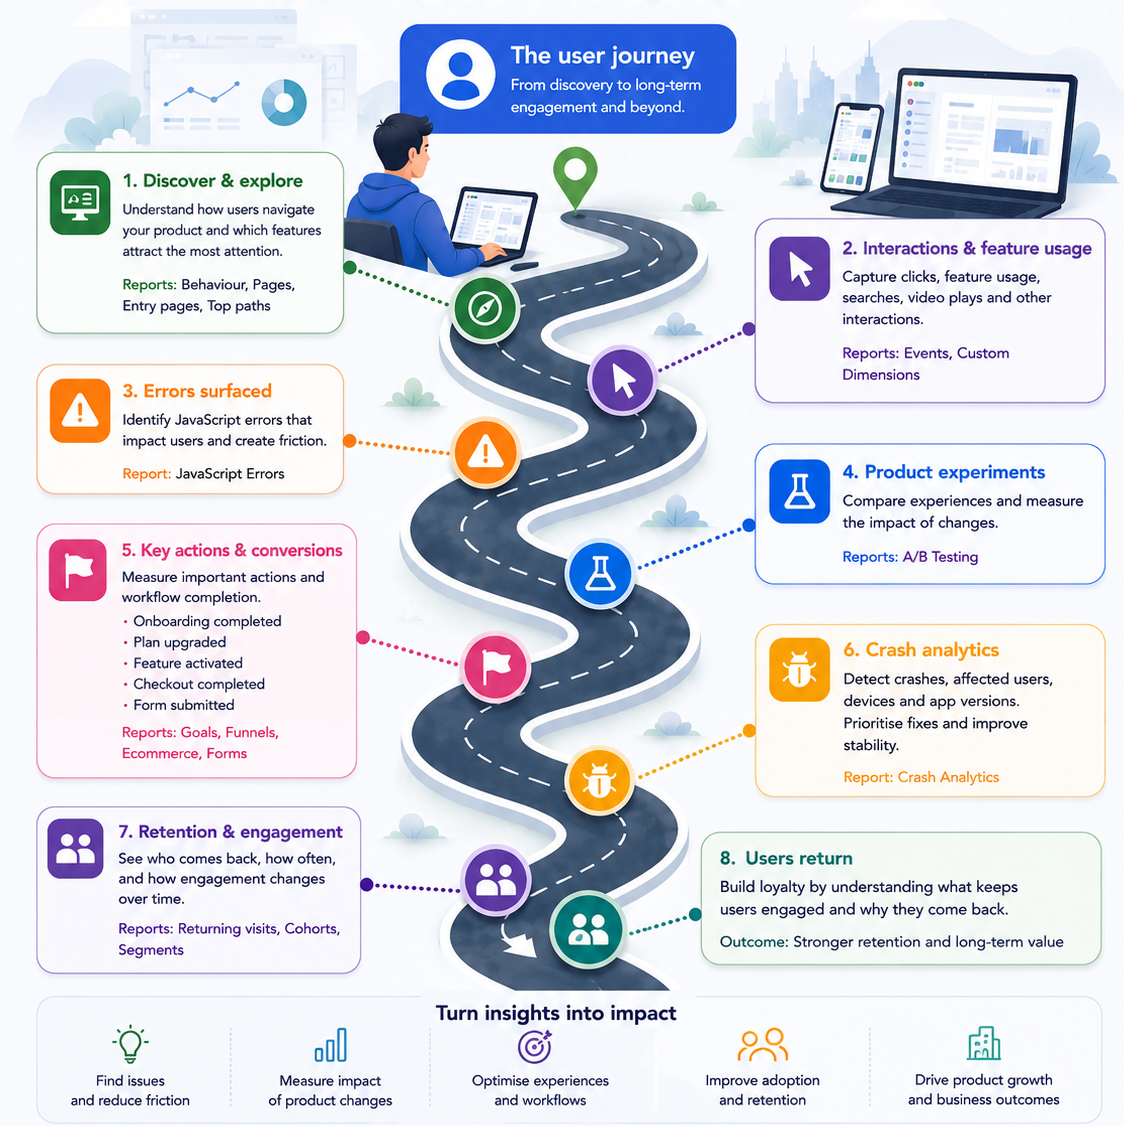
Understand the full product journey by capturing meaningful insights with Matomo. Make data-driven decisions to build better experiences.
Measure product engagement
Product teams often want to understand:
- Which features are used most?
- Where do users abandon key workflows?
- Which screens or pages receive the most engagement?
- How do users navigate through the product?
- Which product changes improve adoption?
Matomo provides several reports to answer these questions:
- Behaviour reports reveal which screens and pages receive the most activity, helping identify popular areas and where users abandon important workflows.
- Events measure specific user interactions such as button clicks, feature usage, video engagement, and workflow actions.
- Custom Dimensions compare behaviour using attributes such as app version, subscription tier, device type, or user role.
- User Flows visualise how users move through applications, onboarding journeys, and business processes.
- Heatmaps and Session Recordings complement quantitative reports by showing how people interact with interfaces, revealing usability issues and unexpected behaviour.
- Crash Analytics provides visibility into JavaScript errors and application crashes, helping product and development teams understand their impact on users, prioritise fixes, and optimise website and application performance.
Together, these reports help product teams understand how people use their products, identify usability and stability issues, optimise websites and applications, and measure the impact of product changes.
Analyse retention and returning users
Acquiring new users is only part of the story. Product teams also need to understand whether people continue using a product over time and what influences long-term engagement. Features such as Returning Visits, Cohorts, and Segments help analyse how engagement changes after onboarding.
Understand conversions and workflows
Most products contain important workflows that contribute to user success or business outcomes. Goals, Funnels, Ecommerce reports, and multi-step journey analysis can be used to measure conversion-focused or operational workflows.
These reports help identify where users complete workflows successfully, where they drop off, and which stages could be improved.
Segment users and product behaviour
Different users often interact with applications in different ways. Segmentation helps reveal behavioural patterns that aren’t visible in overall reports.
Segments and Custom Dimensions can be used to compare different user groups by different attributes such as app version, device type, authenticated user state and more!
Export and visualise product analytics data
Product analytics data can be exported for further analysis and reporting using the API, Custom Reports, scheduled exports, data warehouse integrations, or business intelligence tools such as Power BI, Tableau, Qlik, and Looker Studio.
This allows product teams to build dashboards, combine analytics with other business data, and share insights across the organisation.
Privacy and data ownership
Organisations often need product analytics that aligns with their privacy, security, and governance requirements. Matomo provides flexible deployment options and privacy controls, giving organisations greater control over how product analytics data is collected, stored, and governed.