Embed a Matomo report (or dashboard) in a HTML page
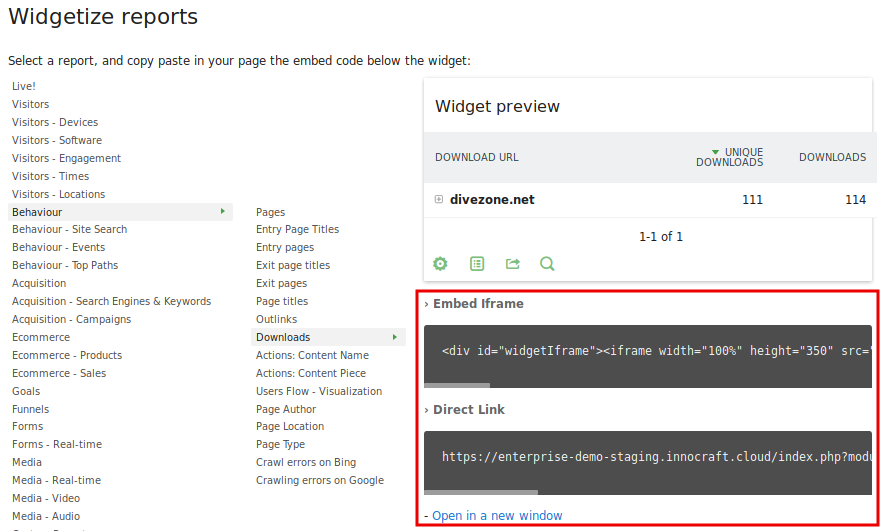
After going through the requirements to embed reports, now you can choose which Matomo reports you want to embed. In Matomo click in the top right menu on Administration, then click on « Platform > Widgets ». In this page all widgets are listed with live preview. When you preview any widget you will see the embed code (highlighted here in red) underneath the preview:
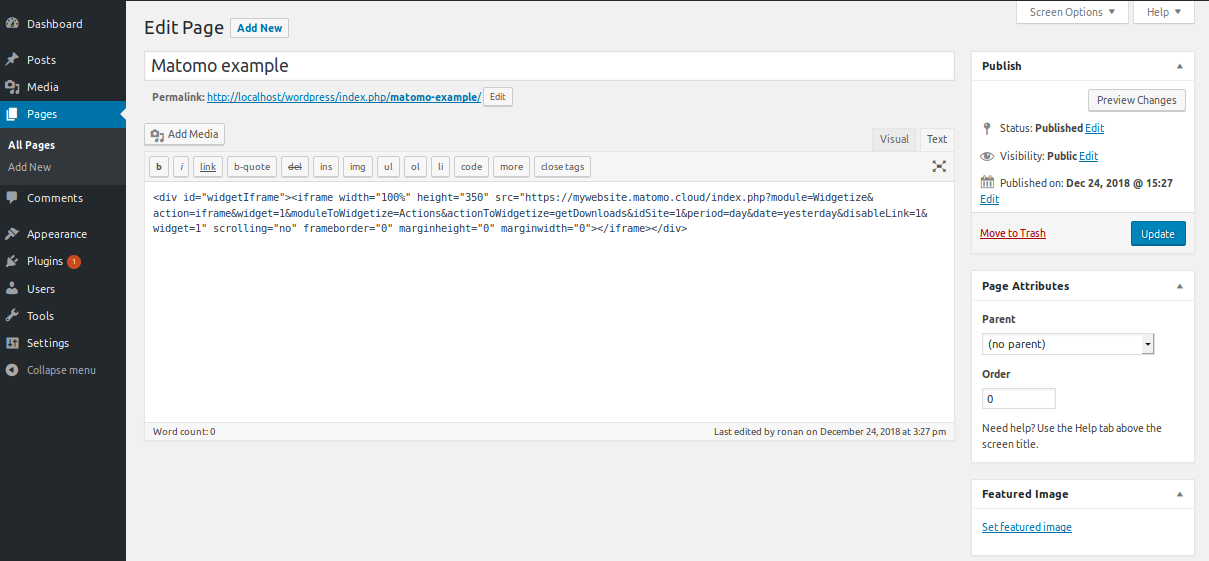
When you have chosen a widget to embed and copied its code, just go to the website in which you wish to insert it, and paste the code where you want it. In the below image, the top downloads report is inserted into a page of its own in a WordPress CMS.
Note: HTML view is selected because an iframe HTML tag is being pasted in:
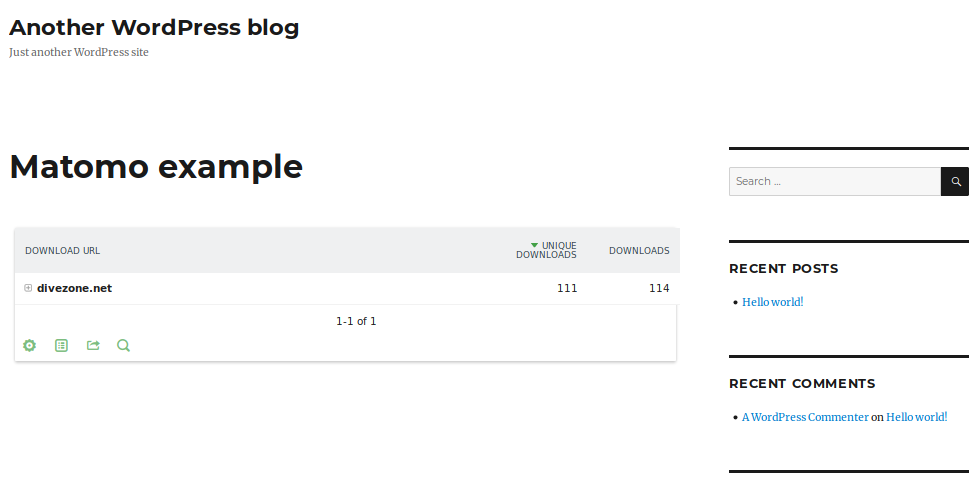
When you click save, you will see the familiar Matomo interface embedded in your site:
Preventing scrollbars from showing up
Scroll bars can be removed by making use of the iframe-resizer library. The iframe will then no longer have a fixed height. Instead, the height of the iframe will be automatically adjusted to the height of the content height of the iframe. That means no vertical scroll bars will be shown for the iframe. To activate this behaviour, simply follow the instructions of the iframe-resizer library:
- Give your iframe an id, for example
matomoframe:<iframe id="matomoframe" ...> - Embed this HTML snippet into your site that embeds the iframe:
<script>iFrameResize({ log: true }, '#matomoframe')</script>
Customising the widgets
To customise the widget date, website id or initial view (table, graph chart, table showing goal metrics) you can edit the parameters in the URL in the embed code:
idSite– website IDperiod– day, week, month, or yeardate– a date (YYYY-MM-DD), date range (YYYY-MM-DD,YYYY-MM-DD), or alias (e.g.,today)disableLink– typically set to 1; when enabled, clicking on the evolution graph redirects the page to the Matomo dashboardviewDataTable– defines the widget visualisation, and can have the following values:tableAllColumnstableGoalstablecloudgraphPiegraphVerticalBargraphEvolution
- show_footer – Some reports let you hide the report footer by setting this parameter to 0
For example, to show widget data as a Bar Chart by default, you can set in the widget URL
&viewDataTable=graphVerticalBar
Embed the Matomo dashboard in a HTML page
As well as embedding single reports, you can also embed the full Matomo Dashboard. In Matomo, click on Administration in the top right corner, then « Platform > Widgets ». In this page you will find the link to embed the full dashboard. This can be very useful for users who wish to integrate Matomo inside another dashboard or app.
Embed the full Matomo app anywhere
You may also embed the full Matomo application within an Iframe. To make this work, a small change to the config file is required: see this FAQ.
Once you have configured the INI setting to allow iframes, you can embed the full Matomo App directly in any HTML page in an iframe.