
Create and analyse Custom Reports
Custom Reports in Matomo provide a flexible way to create tailored analytics reports. While standard reports offer valuable insights, customisation may be necessary for more targeted analysis.
With Custom Reports, report structures can be defined to break down data by any dimension, helping to identify trends. Segments can also be applied to filter reports and examine key metrics for specific audience subsets.
Custom Reports is a premium feature available with a Matomo Cloud plan or as a separate purchase from the Matomo Marketplace for Matomo On-Premise.
Managing Custom Reports
- Log in to Matomo and navigate to Custom Reports in the left menu; or
- Open Administration
 > Websites (or Measurables) > Custom Reports.
 - Select Manage Reports to create new and view existing custom reports.
- Additional metadata fields are displayed for each report: Created by, Creation date, Last updated by, and Last updated date. Learn how report metadata is populated, including why some creator or updater information may show as
Unknown. - Available Actions for each report allow you to:
- Play or Pause to enable or disable selected custom reports (from Custom Reports Plugin version 5.3.0).
- Edit reports to modify their configuration and filters.
- View reports to analyse collected data.
- Copy to duplicate reports for the same website or for other tracked websites. After copying, review and adjust the settings of the new custom report.
- Delete reports to permanently remove reports that are no longer needed.

Paused reports retain all previously archived data but are no longer processed in future archives.This helps reduce system load by preventing unused or experimental reports from consuming resources. To disable a report, click the Pause icon or click the Play icon to restore its processing in scheduled archiving.
Create a Custom Report
- To create a new report, click on Create New Report.
-
Provide a unique Name and optional Description. Depending on your further configuration, the report name will be also used in the reporting menu.

-
Select which website the custom report applies to. Superusers can add a report for across your sites by choosing the All Websites option.
- Select the Report type. This can be a Table report where you can switch between alternative visualisations, Evolution graph, or KPI card to highlight a key metric with a sparkline to show its trend over the selected period.
Report content
- Select the required Dimensions that are shown in the first column of a report. For example Browser, Country, City.
- Select the Metrics, which are quantitative measurements. For example, if you want to increase the traffic on your website, include Visits. If you are improving the performance of your website, include Avg. Generation Time.
Note: From version 5.4.0 of the Custom Reports plugin, Matomo on-premise users can configure the maximum number of dimensions allowed in a custom report.

Report filter
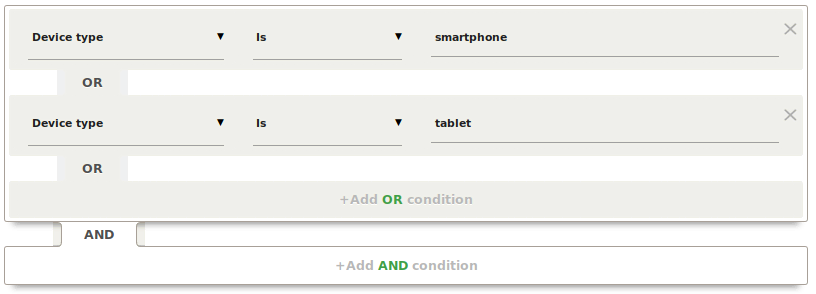
Additionally, you can choose to define a filter. This narrows down the data shown in a report to focus on a subset of your audience based on particular criteria. For example, you can filter a report down by mobile device users only. When defining filters, you can use AND/OR operators to create more complex conditions.
- The AND operator allows you to combine multiple criteria, ensuring that all specified conditions must be met for a data point to be included in the report.
- The OR operator allows for a broader selection, where a data point will be included if it meets any of the specified conditions. If you are already familiar with the segment editor, this will be straight forward for you.
Report category
By default, the created report will be visible under the Custom Reports category in the reporting menu and a new page for this report will be automatically generated. To place the report under a different category, choose the relevant Report category. For example, if your custom report shows more insights about Countries, you may want to add the report to the Visitors > Locations page to view all the location reports in one place.

View Custom Reports
You can view custom reports just like any report in Matomo. They support all the standard features like Row Evolution, Segmented Visits Log, Pivoting, and much more.
You can also add any custom report widget to your dashboard or include them in your scheduled reports.
Test a report configuration
When you create a report and are not sure if the report content gives you the results you are looking for, click Preview Report before creating the report. This lets you quickly verify your configuration based on data for the current day and saves you from having to go back to the report configuration later.
Note: if you have browser archiving disabled, the report may take up to an hour to become available. The just mentioned report preview will still work though, even if browser archiving is disabled.
Examples of custom reports
Performance of pages broken down by minute
Want to see how the page generation time various broken down per minute instead of only getting a daily average? Custom reports lets you view any dimension and metrics broken down by hour or even down by minute.

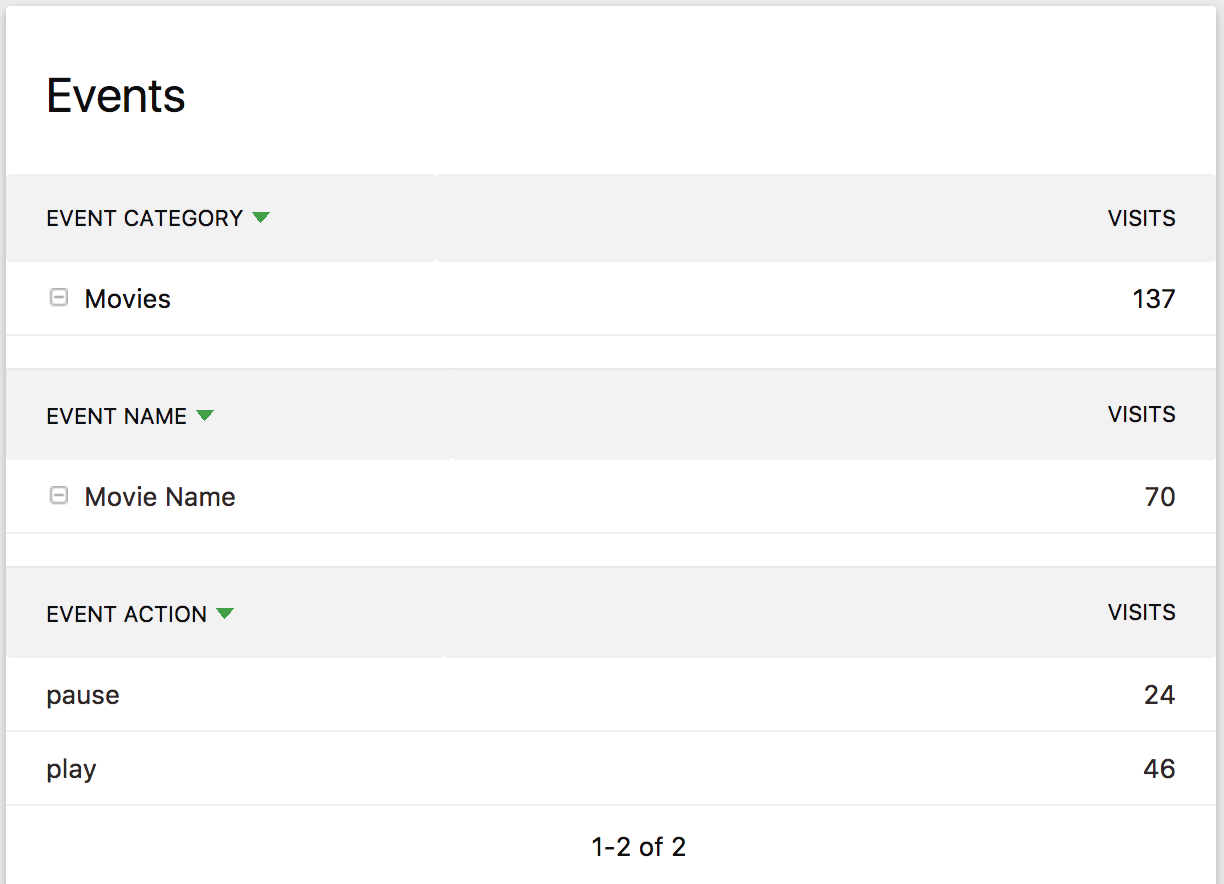
Events over 3 dimensions
Matomo currently lets you only view two combinations of Event Category, Event Name, and Event Action. With Custom Reports you can choose to link all three dimensions to view for example event actions by event name by event category.
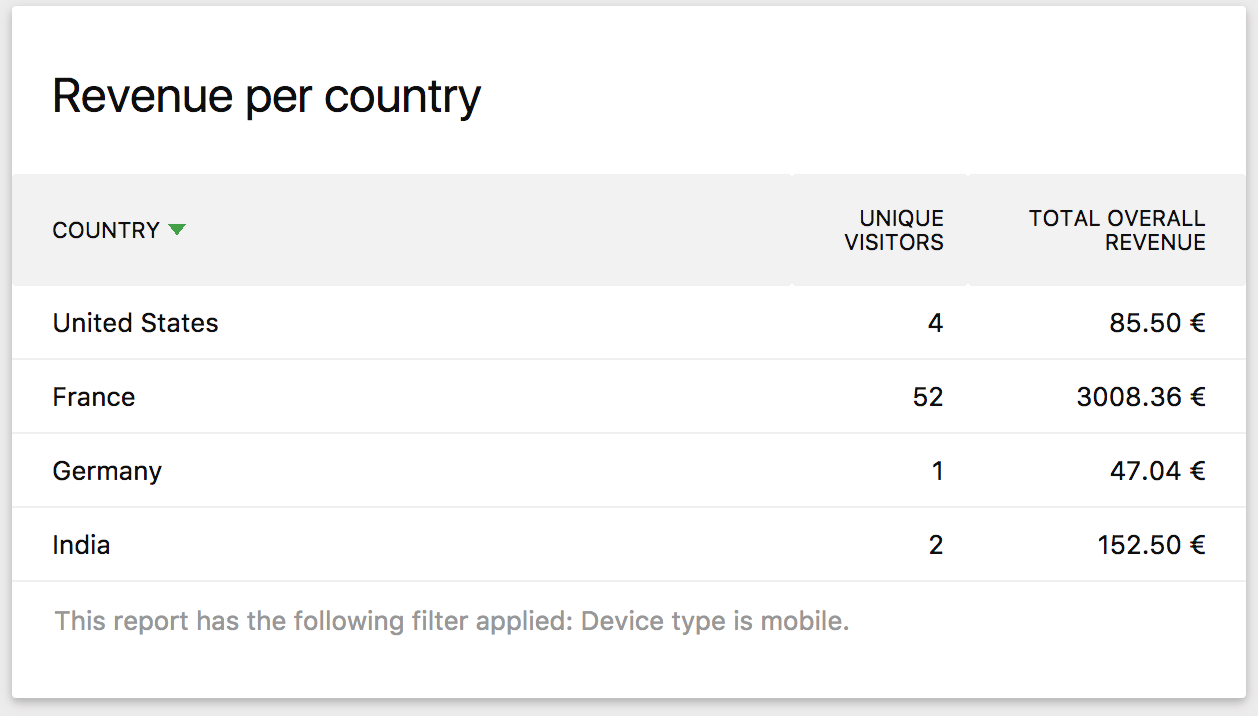
Revenue per country filtered by mobile devices
Wondering which countries contribute the most revenue when you only look at mobile devices?
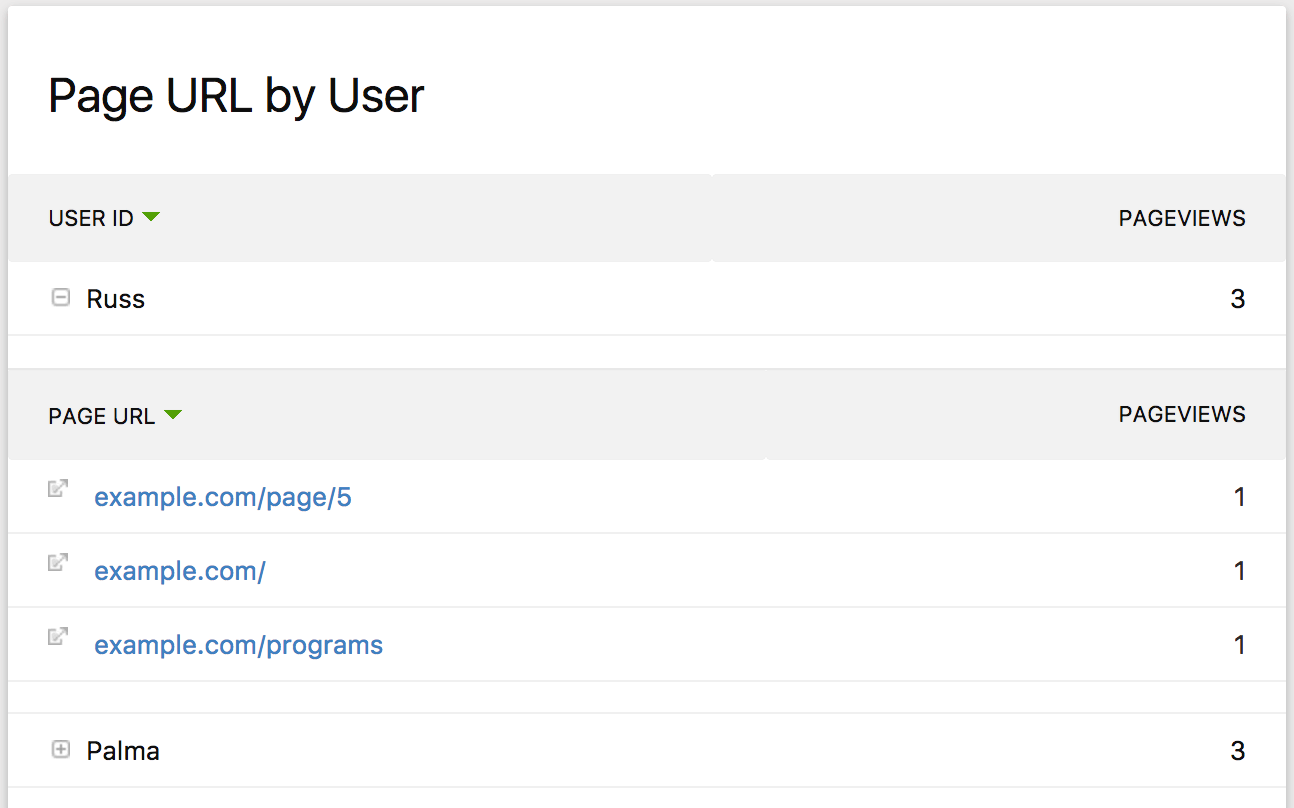
Page URLs by User
Another useful report can be to break down any dimension by users. For example, you could analyse which pages each user has viewed:
Combine dimensions and metrics in countless ways to create reports tailored to your analysis needs.
Reporting features
Custom reports supports common Matomo reporting features such as
Flattening
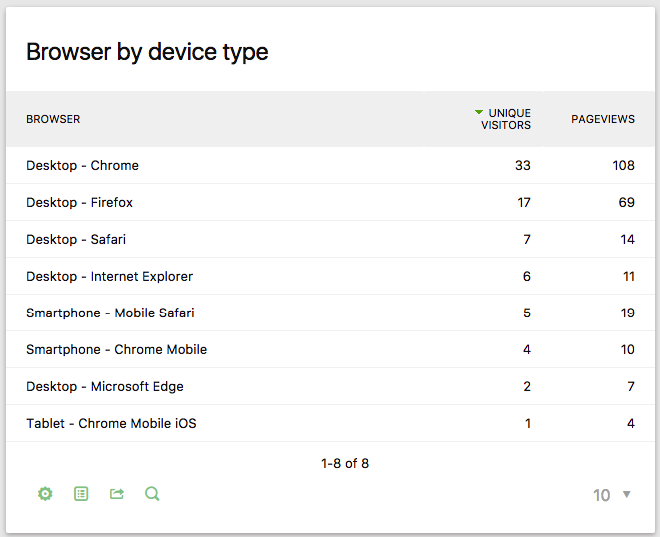
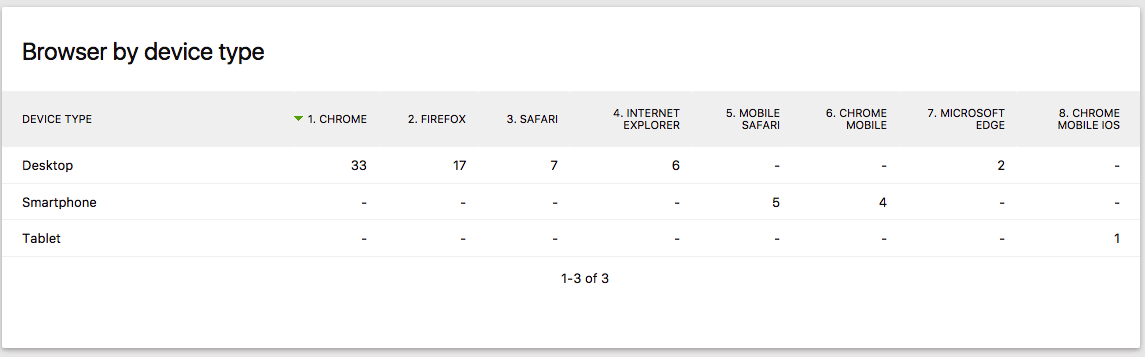
Pivoting
Different visualisations
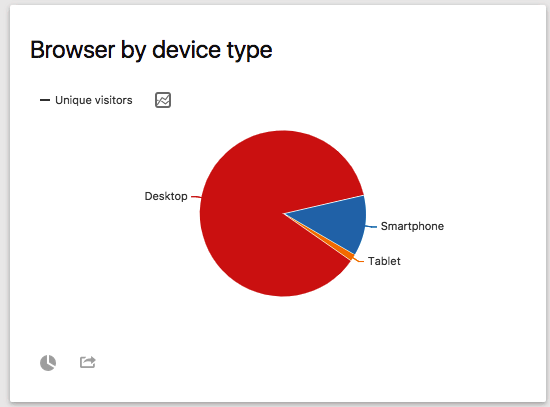
Pie Chart
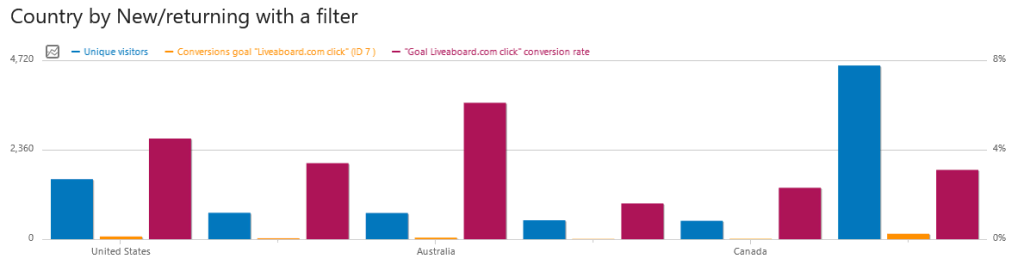
Bar Graph

Evolution Report
Send custom reports by email
Custom reports can also be sent to other users on a schedule when you create Scheduled reports.