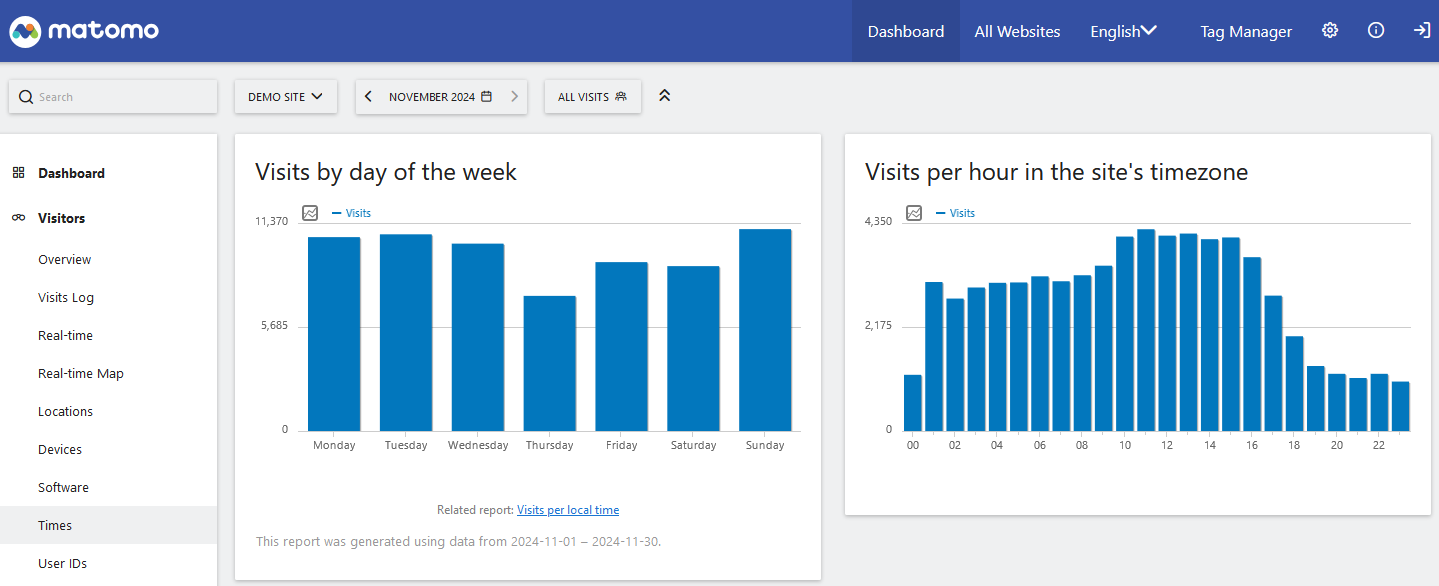
The Visitors Times Report
The Matomo Visitors Times report provides detailed insights into when visitors access your website, in both your site’s time zone and their local time zone. By analysing visitor activity across different hours, days, and months, the reports can reveal time-based patterns to help support decisions for website maintenance, content scheduling, customer service availability, and marketing strategies and campaigns.
You can view these reports in Matomo > Visitors > Times.
View and export the Times reports
The Times report includes the following time-based breakdowns:
- Visits per local time: The report displays visits based on each visitor’s local time zone, making it easier to identify daily activity cycles.
- Visits by day of the week: The report highlights the weekdays with the most traffic, which can help with spotting recurring weekly patterns.
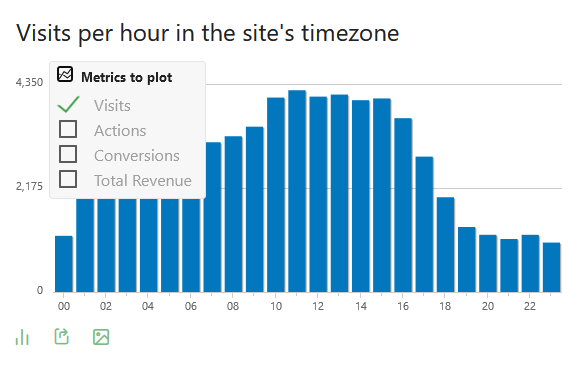
- Visits per hour in the site’s time zone: This report shows how visitor activity is spread across the hours of the day, based on the time zone set for your website. It gives a website-based view of traffic patterns, showing average hourly activity, regardless of where visitors are located.
Visualising time distributions makes it easier to detect peaks, lulls, and repeating patterns. You can use the chart icons to change the visualisation to line graphs, pie charts, or tables and export the data in your preferred format.
To customise the data plotted on the chart, click the ![]() metrics icon. In all the Times reports, you can display Visits and/or Actions and some reports may have additional metrics you can select.
metrics icon. In all the Times reports, you can display Visits and/or Actions and some reports may have additional metrics you can select.
- Visits refers to the number of people visiting within that period.
- Actions includes events such as downloads, searches on your site and other web events initiated by your website visitors.
The different types of Times reports available are detailed below.
Visits per local time report
The Visits per local time report can help you pinpoint when your website experiences the most traffic, events, sales or conversions. By understanding the peak visiting hours, you can determine the best times to launch new campaigns or marketing initiatives to maximise engagement and drive sales.
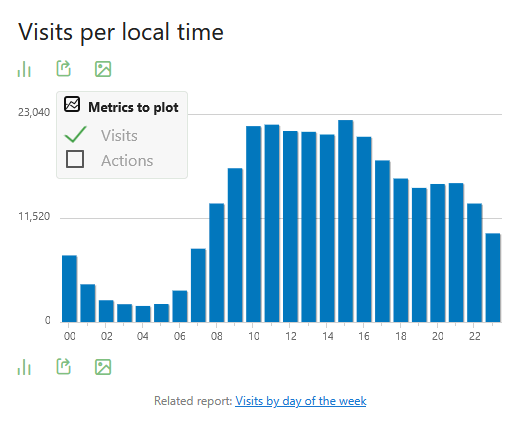
The report contains a link to the related report Visits by day of the week.
Visits by day of the week (Related report)
When viewing the Visits per local time report, click the related report link to load the report view for Visits by day of the week.
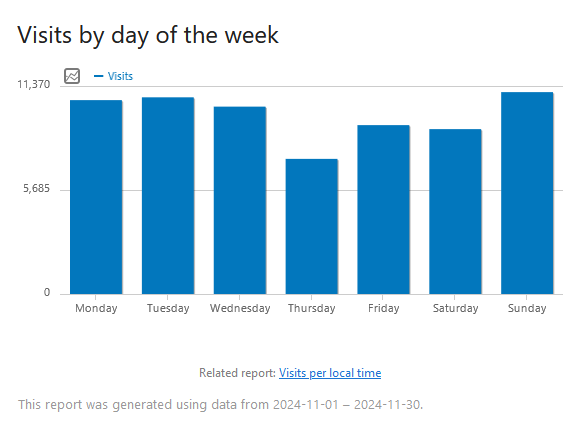
With this report, you can see which days are most popular with your audience. It makes recurring weekly patterns easier to see and compare, helping to understand how audience activity shifts across the week.
Visits per hour in the site’s timezone report
The Visitors > Visits per hour in the site’s timezone report is useful to understand how many visits your site receives on average throughout the day. As this is based on your website’s time, it can be especially helpful for things like scheduling website maintenance for times with low visitor numbers.
You can also click on the line chart icon to select several other metrics to display in the report. When Ecommerce is enabled for your site, additional metrics for Conversions and Total Revenue are available in this chart.
- To check if your website’s time zone is correct, go to Administration
 > Websites > Manage and select the site to review its time zone setting.
Analyse the Times reports
Comparing activity between your site’s time with the visitors’ local time can help identify when campaigns will be most effective across regions. Choose the time period for analysis and view and export reports for a day, week, month, or a custom date range to compare historical trends or compare against a baseline period.
Understanding cause-and-effect:
While analysing reports, it is important to remember that correlations in time-based reports do not prove cause-and-effect. For example, if sales and website traffic increase during the same period, it does not automatically mean that higher traffic caused more sales. Both may be responding to the same external factors, such as a marketing campaign or seasonal demand. As part of the analysis, look at data across multiple years. If peaks or dips occur at the same time each year, they are likely seasonal but if they appear only once, they may be linked to a specific campaign or event.
Daily time patterns
Daily time patterns show how traffic is distributed across the hours of the day. By examining this report, it shows when visitors are most active and when activity slows down. These insights help identify peak hours for publishing new content or launching time-sensitive campaigns.
In contrast, when you know the low-traffic hours, it can support operational decisions for routine maintenance or updates. Comparing traffic across multiple days can also reveal whether daily cycles repeat consistently or vary depending on weekdays, weekends, or special events.
Weekly and Monthly Patterns
Weekly and monthly reports extend the view to longer time frames to see how visitor activity shifts over days of the week, different months, or even over an entire year. For example, weekdays may consistently draw more visits than weekends while holiday periods may show noticeable changes in conversions, which can happen for different reasons.
Some industries see higher activity during holidays due to sales promotions and gift purchases, while others may experience a drop in visits over vacation periods. Understanding these patterns makes it easier to adapt strategies to visitor behaviour, supporting more effective campaign planning, resource allocation, and budget management.
Engagement metrics by time
In addition to traffic levels, it is possible to analyse engagement metrics such as pages per visit, average session duration, or bounce rate for specific time segments.
To do this, create a Custom Report that combines the time dimension with the metrics you want to measure. It can help determine whether periods of high traffic also reflect strong engagement, or if certain times attract visits with less meaningful interactions.
Segmentation by time
In Matomo, Segmentation lets you filter reports by time-based values, making it possible to compare how different periods influence visitor behaviour:
- Visits by hour of the day: Segment by
Local timeorSite time - hour (start of visit)to identify popular times for high traffic, for example, compare if visitors in the morning browse more pages than evening visitors. - Conversions by day of the week or month: Segment by
Time in UTC - day of monthorday of weekto compare whether conversions are higher on weekdays, weekends, or specific months.
By basing Segments on time-related values, reports help identify recurring patterns, seasonal effects, or changes linked to campaigns.
Time-based goals and conversions
Goals and conversions can also be analysed by reviewing when conversions (such as purchases or newsletter sign-ups) occur. This can help determine:
- Optimal times for campaign launches. For example, an online retailer may find increased traffic on certain mornings could be the best time for promotions.
- When visitors are most likely to complete transactions. For example, an NGO might see an increase in donations during holiday periods or for year-end tax purposes.
- Periods where conversion rates drop and may require optimisation. For example, a software company could notice that trial sign-ups decline after a certain time of day, which may suggest calls-to-action or messaging needs improvement to engage visitors browsing outside of standard working hours.
Device and Channel behaviour
Visitor behaviour can often vary depending on both the device used and the channel through which they arrive. Analysing these patterns in a time context can provide insights into how engagement differs across situations, for example:
- Mobile usage might increase during commuting hours or weekends, when visitors are more likely to browse on mobile devices.
- Email campaigns tend to drive traffic at specific times of day, such as mornings when inboxes are first checked.
- Paid search or social media campaigns may produce bursts of activity that correspond to campaign timing or ad scheduling.
You can use Segments or Custom Reports to filter by channel, device type and time to understand when mobile visitors or campaigns drive the most valuable engagement.