Analyse Users Flow reports
Users Flow is a premium feature which is included in all our Cloud-hosted plans or you can purchase it on the Matomo Marketplace if you self host Matomo On-Premise.
Viewing the Users Flow visualisation
Go to Matomo and in the menu click Behaviour > Users Flow. You will see a visualisation of the most popular pages and the paths your users took over several steps.

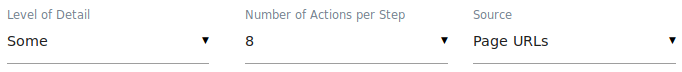
In the top left, you can adjust the report to show more or less details and to change the number of actions per interaction step.
The visualisation lets you dig into the data in many different ways. You can see tabular list of all interactions by clicking on an Interaction title or by clicking on a green node and then selecting Show details.
This way you can also find out which pages were grouped together under Others. If you are interested in how your users came to a particular page at a particular step and where they went to next, click on a green node and then select Explore traffic. This will show you for example the flow for all visitors or users that have visited a page “/start” at interaction step 2.

You can add this visualisation to your dashboard and export the view to share it with your colleagues or clients. The data is also accessible on the Matomo Mobile app.
Viewing the most popular paths and visitor engagement
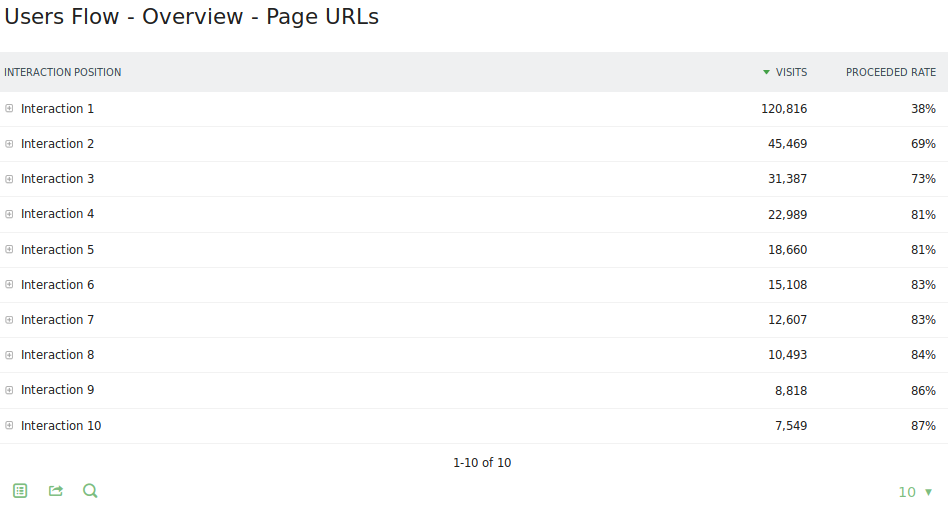
To analyse more Users Flow reports, click in the menu on Behaviour and then Top Paths. At a glance, you will see which paths your users take most often.
The Overview lets you investigate the visitor engagement, for example after how many interactions your visitors drop off. By clicking on a row, you can view which pages were most frequently visited at a particular interaction step and the subsequent pages they navigated to. The URLs displayed represent the paths taken between pages that led to a specific interaction stage.The data in this Overview report table is the same as the data displayed in the Users Flow visualisation but there are times where it is more helpful to explore it in a tabular way.
Applying segments
The Users Flow gets even more valuable when you apply segments. Learn for example how your visitors navigate through your website when they enter it for the first time by applying the segment “Visit type is new”. Understand how your visitors browsed through your website that have converted a goal by applying the segment “Visit converted a specific goal”. Or maybe you want to analyse and compare how the paths vary depending on a different country or referrer? You can apply any Matomo segment to the Users Flow reports.