How to import Matomo data into Qlik Sense
Qlik Sense (part of Qlik Cloud) is a data analytics and visualisation tool designed to explore, analyse, and present data from multiple sources. It combines data modelling with an interactive user interface for technical and non-technical users to build dashboards and reports. Qlik Sense requires three key components to import Matomo data: spaces, data connections, and apps.
- A space is the workspace and governance layer where you create your data connection and analytics app and analytics assets.
- The analytics app contains your data model, load script, and visualisation sheets.
- A data connection defines how Qlik Sense accesses a data source such as via REST APIs, file imports, and more. Depending on your Qlik plan, you may have access to set up connections to data warehouse sources such as Amazon S3, Google BigQuery, Google Cloud Storage, or Snowflake.
This guide describes two methods for importing Matomo data into a selected Qlik space: using a REST connector or uploading files to create datasets.
Before you start
- First, you will need admin access to a Qlik Sense account to prepare your Qlik environment.
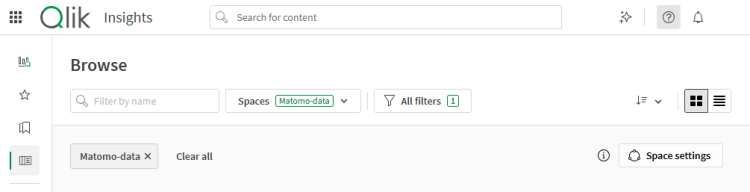
- Create or select a space (Personal, Shared, or Managed) that will contain the Matomo app and data connection. Read the Qlik documentation for guidance on creating spaces.
- In Matomo, you will need to generate a
token_authfor the Qlik data connection. Make sure it is not enabled for secure requests only. Learn how to generate the Matomo token_auth. - Once the environment is set up, proceed to the next section to set up the data connection in Qlik.
Create a data connection
A data connection defines how Qlik accesses your source data. Connections can be created from within an app or directly in the space with defined permissions. The following section covers the REST connector setup and how to import files to create datasets. Both options let you build and manage reusable connections within a space so that your apps can load and model Matomo data for analysis.
Use the REST connector
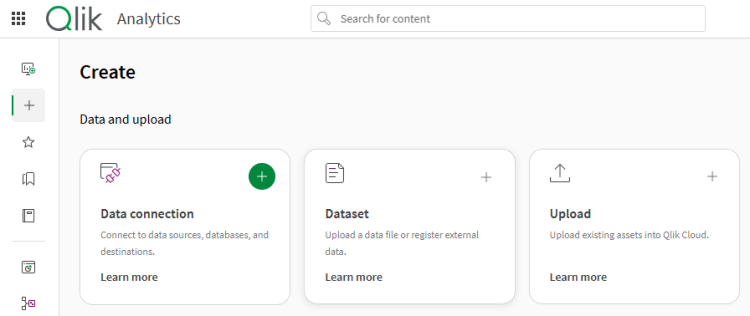
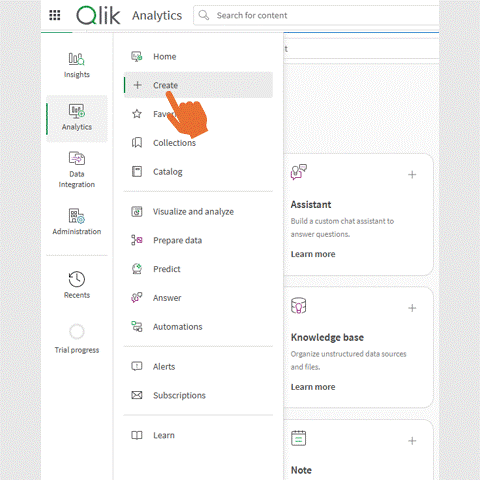
- Open the Analytics menu and click + Create.
- Under Data and upload, select Data connection.
- In the next screen, search for and select the REST connector. the REST connector to retrieve data directly from the Matomo API.

- For the Request URL, provide the Matomo API endpoint and append the
token_auth. For example:site.matomo.cloud/index.php?module=API&method=Events.getCategory&idSite=1&period=day&date=last30&format=JSON&token_auth=123 - Define the connection settings as required and click Test connection. You should see a verification message when the test is successful.
- If an error occurs, check you are using the correct
token_auth, which must not be enabled for secure requests in the Matomo token settings. - Click Create to save the new data connection.
Import files to create datasets
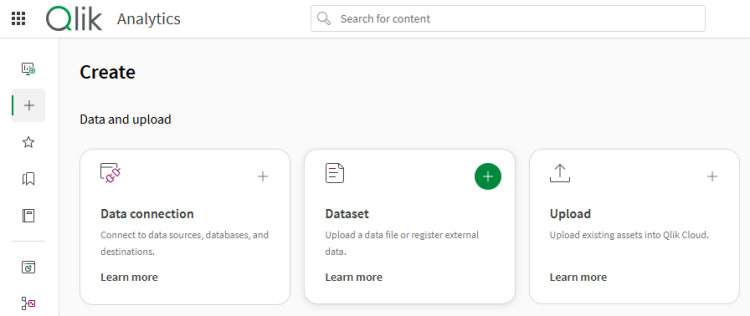
- Open the Analytics menu and click + Create.
- Under Data and upload, select Dataset.
- You can choose to create datasets by uploading files or creating a data connection. This example covers the Upload data file option.
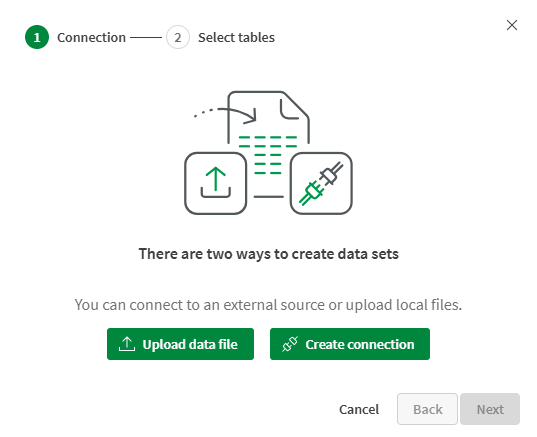
- Select Upload data file and click Next.
- In the next screen, drag-and-drop your files to upload or use the Browse option to locate and select the files to import.
- The Path must reflect the path to the correct space where the files will be uploaded to.
- Click Upload (or Upload and analyze).
Create a Qlik Sense Analytics app
The app contains your data model, load script, and visualisation sheets. Apps created in the same space can share data connections, depending on permissions. While you can reference or create data connections from within an app, those connections are stored as resources in the associated space.
- Open the Analytics menu and click + Create.
- Under Content and collaboration, select Analytics app.
- Provide a name for the app and select the right space that the app will be saved to.
- You can optionally add a description and tags.
- The Open app setting is enabled by default, which is useful to edit the app once it is created.
- Click Create.
- You will be prompted to choose how to load data into the app:
- Data catalog: Select to browse the catalog for existing datasets (imported files).
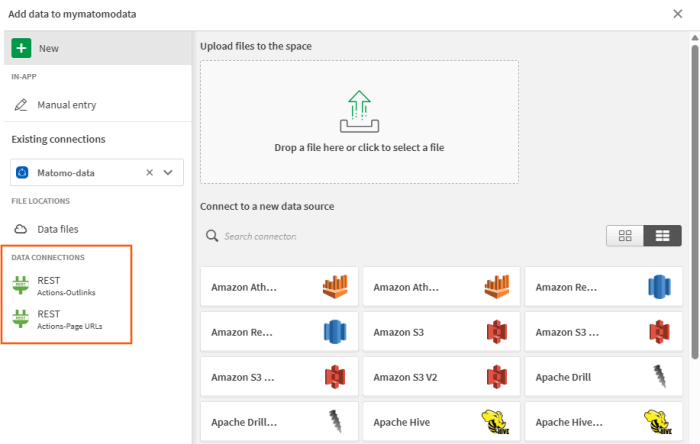
- Files and other sources: Select to browse for data files, existing data connections, and you can import new files and create a new data connection.
- Data load editor: Select to use a script to load the data.
Add data from the Data catalog
- If you choose the Data catalog option to load data into your app, your Qlik Analytics catalog will open and display existing datasets.
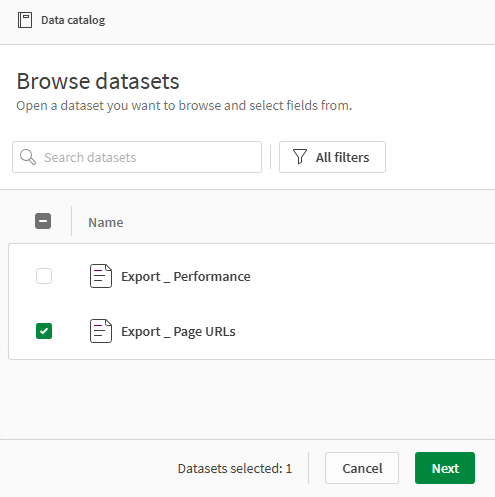
- Select the datasets and click Next.
- Review the summary and click Load into app.
- Alternatively, if you click Continue browsing, you can search for and select multiple datasets.
- When the data loads, it will open the visualisation tools.
- Go to the Visualise and analyse section below to learn how to start building reports.
Add data from Files and other sources
- If you choose the Files and other sources option to load data into your app, the list of available data files and data connections are shown.
- Select an existing file connection or you can choose to upload new files or create a new data connection.
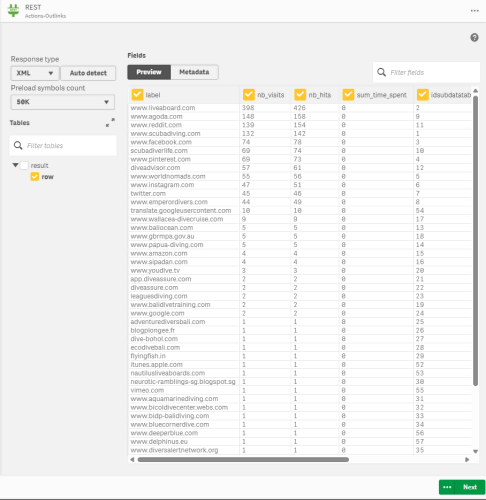
- For example, choose an existing data connection and click Next.
- In the Preview, select the table and click Next.
- When the data loads, it will open the visualisation tools.
- Go to the Visualise and analyse section below to learn how to start building reports.
Add data using the Data load editor
- If you choose the Data load editor option to load data into your app, the script editor will open.
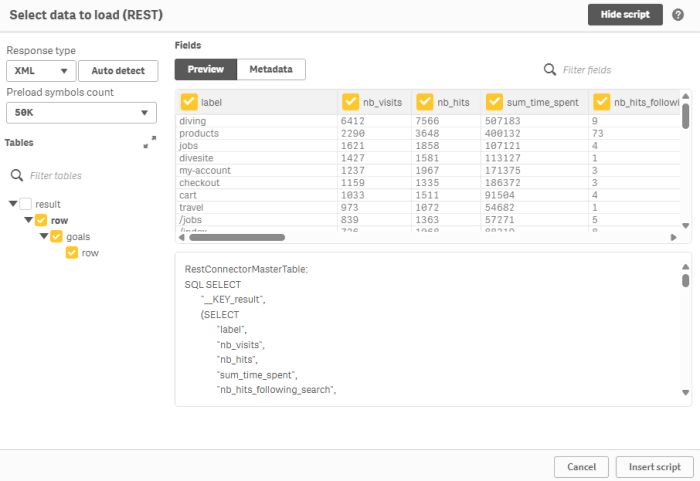
- In the data connection panel, locate the REST data connector and click on the option, Select data.
- Qlik will preview the response and generate the correct script automatically and add the
RestConnectorMasterTablecomponents. - Select the table shown in the preview (often a single array/root), and click Insert script.
- Qlik inserts the auto-generated script into the editor. You can edit the script as required, for example, if loading the Matomo events data, modify the script to create a single
Pagestable and a separatePageGoalstable.
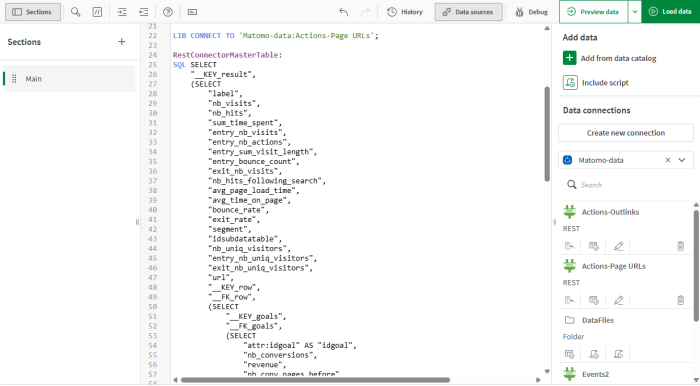
- Click Load data to execute the script and close the app.
- Go to the Visualise and analyse section below to learn how to start building reports.
Visualise and analyse Matomo data in Qlik
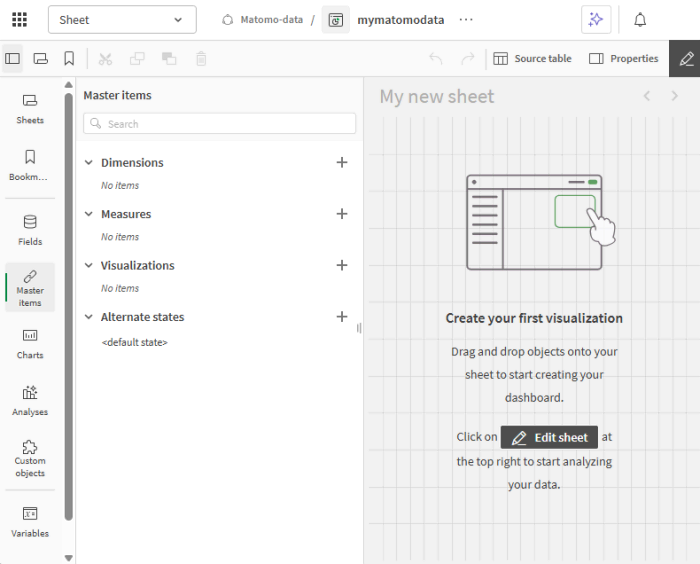
- After adding data to your app from the Data catalog or Files and other sources, Qlik by default, opens the visualisation tools to create new sheets and add analytics assets.
- You can also open an app from the Analytics > Data catalog page to build visualisation sheets.
-
In the app, use the top drop-down menu to navigate between sheets, the data manager, data model viewer and other features.

-
Click Create new sheet and open it to edit.
A sheet is where you arrange charts, tables, KPIs, and filters to explore and present data. Each sheet can focus on a different topic, for example, traffic overview or conversions. The data displayed comes from your data model (loaded through scripts or connections), not from manually entered cells. -
By default, Qlik opens Assets > Master items to create master dimensions and measures for naming, formatting, and reuse. You can add charts without masters, but creating them first makes everything consistent and reusable.
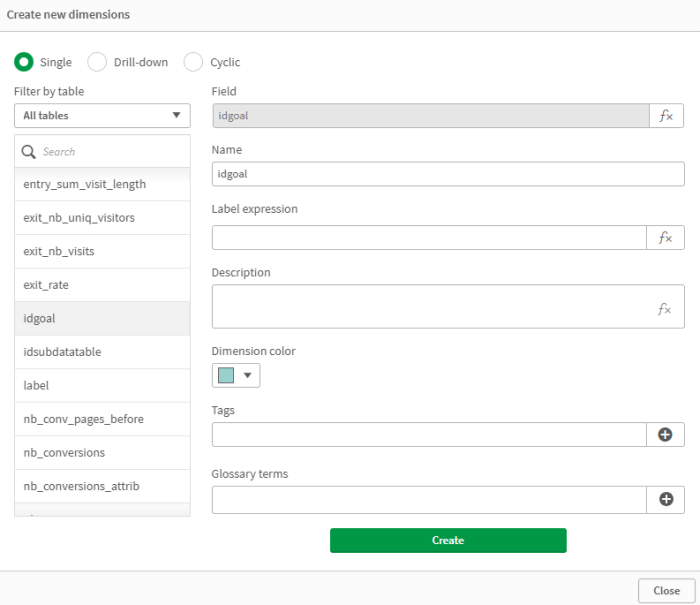
- Under Master items, click the plus icon + to add a new Dimension.
- Create dimensions for the core fields that you will reuse (e.g., Page URL, Event Category, Campaign, Device Type, Goal).
- Under Master items, click the plus icon + to add a new Measure.
- A master measure is a reusable calculation that defines how a metric is displayed throughout your app. You can add expressions using fields and functions from your data model, apply aggregation functions, and insert variables.
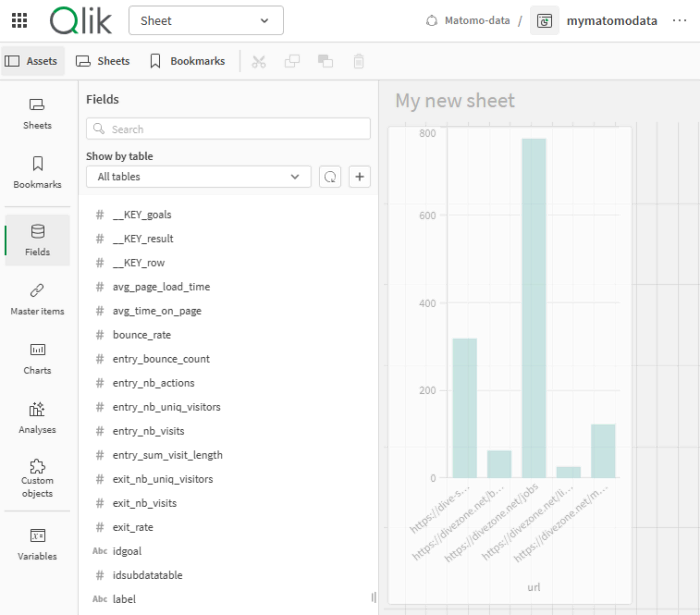
- To start building your first visualisation, click Edit sheet in the new sheet workspace.
- Drag-and-drop master dimensions and measures onto the sheet to create a new chart and customise as needed, for example, choose a chart type, configure properties, and add filters.
- To add metrics to the chart, click on the Fields option in the left menu panel.
- Drag-and-drop the required fields onto the relevant chart.
- Once your charts and filters are in place, review the layout for clarity and consistency and save your changes.
- Click on the Analyses option in the left menu panel to switch to analyse mode. This helps test the chart’s interactivity and confirm that selections, filters, and calculations behave as expected.
Publish and bookmark your app
If you are using shared or managed spaces, you can move the app to a published space or publish your changes. You can also go to Bookmarks > Create bookmark to set a visualisation as a default view for users to see specific reports when opening the app.
It is also important to check that users and roles within the space have access to the app and its associated data connections. Read the official Qlik documentation on publishing apps. With your app published and a default view configured, your visualisation is ready for exploration and collaboration.