Downloading and sending your custom reports by email
In the Matomo top bar, click on Matomo settings (Administration) ![]() > Personal > Schedule reports to view the list of scheduled email reports. The example shows reports already created for this website:
> Personal > Schedule reports to view the list of scheduled email reports. The example shows reports already created for this website:
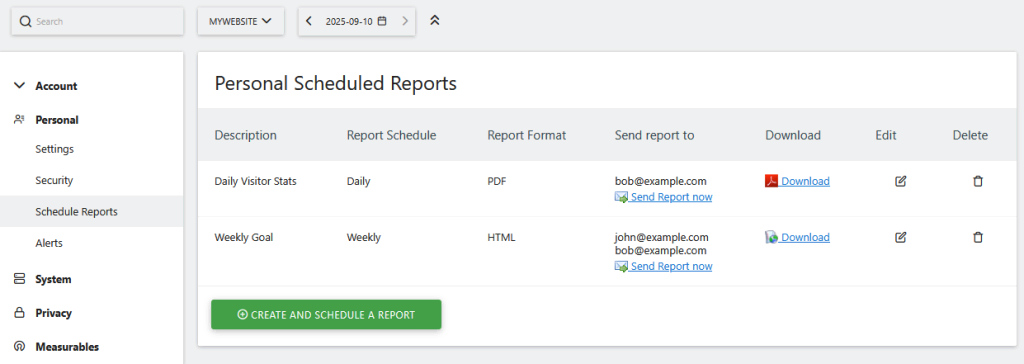
You can click Download or Send Report now to check that the email report works as expected, and contains all the reports you and your colleagues need. When you click either of two options, the reports will contain information for the date currently selected in the calendar. However, when reports are sent automatically daily/weekly/monthly, the reports will automatically be sent for the previous day/week/month respectively.
By default, some reports (such as « visits overview » and « goals », for example) will include the evolution graph to give some historical context about website traffic and performance:

Email reports (PDF or HTML or CSV) and graphs will also display in languages using other character sets (assuming you uploaded the unicode font), such as this example of a report generated by a Japanese Matomo (Piwik) user:

If you selected the option to include graphs in the report, here is an example « Top Browsers » page from a PDF email report:

If you selected « Show Historical Graphs for the top 5 values » to get a historical graph displayed above each report, this is how it would look like, here is an example for the Acquisition Channel Type report:
