

In the web analytics world, we have no shortage of data — clicks, views, scrolls, bounce rates — yet still struggle to extract valuable, actionable insights. There are facts and figures about any action anybody takes (or doesn’t take) when they visit your website, place an order or abandon their shopping cart. But all that data is often without context.
That’s where dashboards come in: More than visual summaries, the right dashboards give context, reduce noise, and help us focus on what matters most — whether it’s boosting conversions, optimising campaigns, or monitoring data quality and compliance efforts.
In this article, we’ll focus on:
- The importance of data quality in web analytics dashboards
- Different types of dashboards to use depending on your goals
- How to work with built-in dashboards in Matomo
- How to customise them for your organisation’s needs
Whether you’re building your first dashboard or refining a mature analytics strategy, this guide will help you get more out of your data.
What is a web analytics dashboard?
A web analytics dashboard is an interactive interface that displays key website metrics and data visualisations in an easy-to-grasp format. It presents key data clearly and highlights potential problems, helping users quickly spot trends, patterns, and areas for improvement.
Dashboards present data in charts, graphs and tables that are easier to understand and act upon. Users can usually drill down on individual elements for more detail, import other relevant data or adjust the time scale to get daily, weekly, monthly or seasonal views.
Types of web analytics dashboards
Web analytics dashboards may vary in the type of information they present and the website KPIs (key performance indicators) they track. However, sometimes the information can be the same or similar, but the context is what changes.
Overview dashboard
This offers a comprehensive overview of key metrics and KPIs. For example, it might show:
- Traffic metrics, such as the total number of sessions, visits to the website, distinct users, total pages viewed and/or the average number of pages viewed per visit.
- Engagement metrics, like average session duration, the bounce rate and/ or the exit rate by specific pages.
- Audience metrics, including new vs. returning visitors, or visitor demographics such as age, gender or location. It might also show details of the specific device types used to access the website: desktop, mobile, or tablet.
An overview dashboard might also include snapshots of some of the examples below.
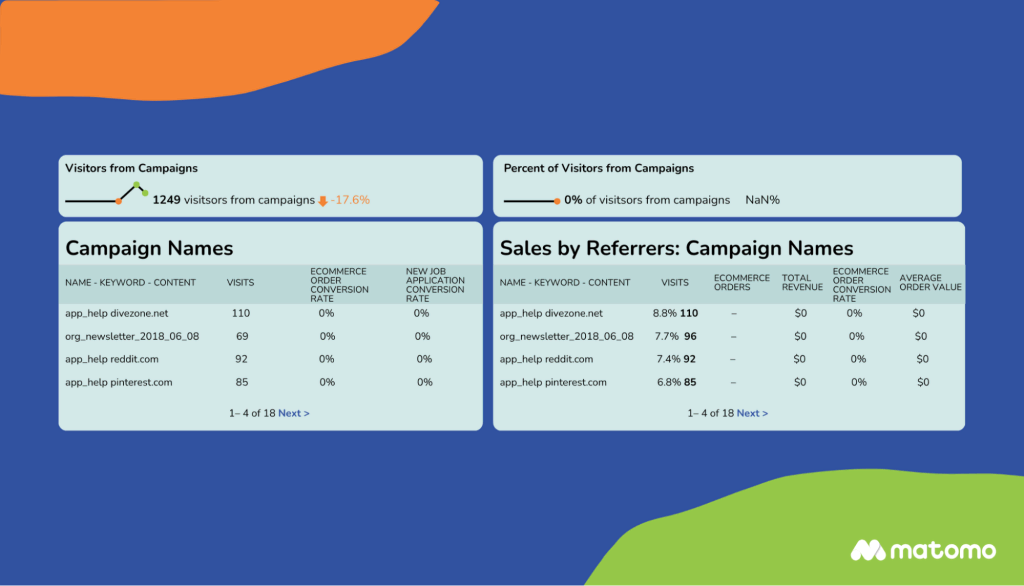
Acquisition dashboard
This reveals how users arrive at a website. Although an overview dashboard can provide a snapshot of these metrics, a focused acquisition dashboard can break down website traffic even further.
They can reveal the percentages of traffic coming from organic search engines, social platforms, or users typing the URL directly. They can also show referrals from other websites and visitors clicking through from paid advertising sources.
An acquisition dashboard can also help measure campaign performance and reveal which marketing efforts are working and where to focus efforts for better results.
Behavioural dashboard
This dashboard shows how users interact with a website, including which pages get the most traffic and how long visitors stay before they leave. It also reveals which pages get the least traffic, highlighting where SEO optimisation or greater use of internal links may be needed.
Behavioural dashboards can show a range of metrics, such as user engagement, navigation, page flow analysis, scroll depth, click patterns, form completion rates, event tracking, etc.
This behavioural data lets companies identify engaging vs. underperforming content, fix usability issues and optimise pages for better conversions. It may even show the data in heat maps, click maps or user path diagrams.
Goals and ecommerce dashboard
Dashboards of this type are mostly used by e-commerce websites. They’re useful because they track things like sales goal completions and revenue targets, as well as conversions, revenue, and user actions that deliver business results.
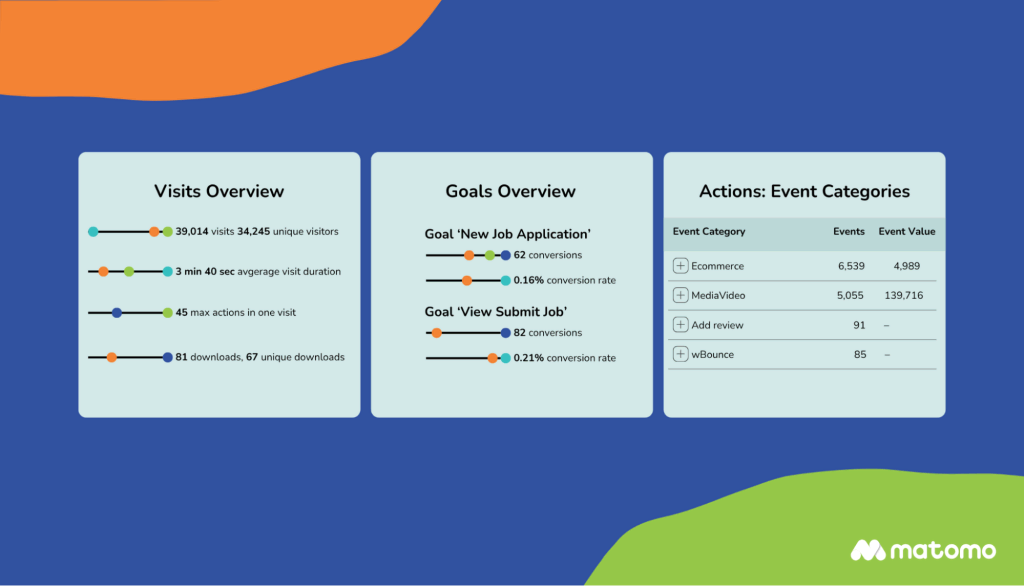
The typical metrics seen here are:
- Goal tracking (aka conversions) in terms of completed user actions (form submissions, sign-ups, downloads, etc.) will provide funnel analysis and conversion rates. It’ll also give details about which traffic sources offer the most conversions.
- Revenue tracking is provided via a combination of metrics. These include sales and revenue figures, average order value, top-selling items, revenue per product, and refund rates. It can also reveal how promotions, discounts and coupons affect total sales.
- Shopping behaviour analysis tracks how users move from browsing to cart abandonment or purchase.
These metrics help marketing teams measure campaign ROI. They also help identify high-value products and audiences and provide pointers for website refinement. For example, checkout flow optimisation might reduce abandonment.
Technical performance dashboard
This monitors a website’s technical health and performance metrics. It focuses on how a website’s infrastructure and backend health affect user experiences. It’ll track a lot of things, including:
- Page load time
- Server response time
- DNS lookup time
- Error rates
- Mobile optimisation scores
- Browser usage
- Operating system distribution
- Network performance
- API response times
- Core web vitals
- Mobile usability issues
This information helps organisations quickly fix issues that hurt SEO and conversions. It also helps to reduce errors that frustrate users, like checkout failures. Critically, it also helps to improve reliability and avoid downtime that can cost revenue.
Geographic dashboard
When an organisation wants to analyse user behaviour based on geographic location, this is the one to use. It reveals where website visitors are physically located and how their location influences their behaviour. Here’s what it tracks:
- City, country/region
- Granular hotspots
- Language preferences
- Conversion rates by location
- Bounce rates/engagement by location
- Device type: Mobile vs. tablet vs desktop
- Campaign performance by location
- Paid ads effectiveness by location
- Social media referrals by location
- Load times by location
Geographic dashboards allow companies to target marketing efforts at high-value regions. They also inform content localisation in terms of language, currency, or offers. And they help identify and address regional issues such as speed, payment methods, or cultural relevance.
Custom segments dashboard
This kind of dashboard allows specific subsets of an audience to be analysed based on specific criteria. For example, these subsets might include:
- VIP customers
- Mobile users
- New vs. returning visitors
- Logged-in users
- Campaign responders
- Product category enthusiasts.
What this dashboard reveals depends very much on what questions the user is trying to answer. It can provide actionable insight into why specific subsets of visitors or customers drop off at certain points. It allows specific metrics (bounce rate, conversions, etc.) to be compared across segments.
It can also track the performance of marketing campaigns across different audience segments, allowing marketing efforts to be tailored to serve high-potential segments. Its custom reports can also assist in problem-solving and testing hypotheses.
Content performance dashboard
This is useful for understanding how a website’s content engages users and drives business goals. Here’s what it tracks and why it matters:
- Top-performing content
- Most viewed pages
- Highest time-on-page content
- Most shared/linked content
- Engagement metrics
- Scroll depth (how far users read)
- Video plays/podcast listens
- PDF/downloads of gated content
- Which content pieces lead to
- Newsletter sign-ups
- Demo requests
- Product purchases
- SEO health
- Organic traffic per page
- Keyword rankings for specific content
- Pages with high exit rates
- Content journey analysis
- Entry pages that start user sessions
- Common click paths through a site
- Pages that often appear before conversions
All this data helps improve website effectiveness. It lets organisations double down on what works, identify and replicate top-performing content and fix underperforming content. It can also identify content gaps, author performance and seasonal trends. The data then informs content strategy and optimisation efforts.
The importance of data quality
The fundamental reason we look at data is to make decisions that are informed by facts. So, it stands to reason that the quality of the underlying data is critical because it governs the quality of the information in the dashboard.
And the data source for web analytics dashboards is often Google Analytics 4 (GA4), since it’s free and frequently installed by default on new websites. But this can be a problem because the free version of Google Analytics is limited and resorts to data sampling beyond a certain point. Let’s dig into that.
Google Analytics 4 (GA4)
It’s the default option for most organisations because it’s free, but GA4 has notable limitations that affect data accuracy and functionality. The big one is data sampling, which kicks in for large datasets (500,000+ events). This can skew reporting because the analysis is of subsets rather than complete data.
In addition, user privacy tools like ad blockers, tracking opt-outs, and disabled JavaScript can cause underreporting by 10-30%. GA4 also restricts data retention to 2-14 months and offers limited filtering and reduced control over data collection thresholds. Cross-domain tracking requires manual setup and lacks seamless integration.
One solution is to upgrade to Google Analytics 360 GA360, but it’s expensive. Pricing starts at ~$12,500/month (annual contract) plus $150,000 minimum yearly spend. The costs also scale with data volume, typically requiring $150,000−500,000 annually.

Matomo’s built-in dashboards
Matomo is a better solution for organisations needing unsampled data, longer data retention, and advanced attribution. It also provides functionality for enterprises to export their data and import it into Google BigQuery if that’s what they already use for analysis.
Matomo Analytics takes a different approach to data quality. By focusing on privacy and data ownership, we ensure that businesses have full control over all of their data. Matomo also includes a range of built-in dashboards designed to meet the needs of different users.
The default options provide a starting point for tracking key metrics and gaining insight into their performance. They’re accessible by simply navigating to the reports section and selecting the relevant dashboard. These dashboards draw on raw data to provide more detailed and accurate analysis than is possible with GA4. And at a fraction of the price of GA360.
You can get Matomo completely free of charge as a self-hosted solution or via Matomo Cloud for a mere $29/month — vs. GA360’s $150k+/year. It also has other benefits:
- 100% data ownership and no data sampling
- Privacy compliance by design:
- GDPR/CCPA-ready
- No ad-blocker distortion
- Cookieless tracking options
- No data limits or retention caps
- Advanced features without restriction:
- Cross-domain tracking
- Custom dimensions/metrics
- Heatmaps/session recordings
Customisation options
Although Matomo’s default dashboards are powerful, the real value lies in the customisation options. These extensive and easy-to-use options empower users to tailor custom dashboards to their precise needs.
Unlike GA4’s rigid layouts, Matomo offers drag-and-drop widgets to create, rearrange or resize reports effortlessly. You can:
- Add 50+ pre-built widgets (e.g., traffic trends, conversion funnels, goal tracking) or create custom SQL/PHP widgets for unique metrics.
- Segment data dynamically with filters (by country, device, campaign) and compare date ranges side-by-side.
- Create white-label dashboards for client reporting, with custom logos, colours and CSS overrides.
- Schedule automated PDF/email reports with personalised insights.
- Build role-based dashboards (e.g., marketing vs. executive views) and restrict access to sensitive data.
For developers, Matomo’s open API enables deep integrations (CRM, ERP, etc.) and custom visualisations via JavaScript. Self-hosted users can even modify the core user interface.
Matomo: A fully adaptable analytics hub
Web analytics dashboards can be powerful tools for visualising data, generating actionable insights and making better business decisions. But that’s only true as long as the underlying data is unrestricted and the analytics platform delivers high-quality data for analysis.
Matomo’s commitment to data quality and privacy sets it apart as a reliable source of accurate data to inform accurate and detailed insights. And the range of reporting options will meet just about any business need, often without any customisation.
To see Matomo in action, watch this two-minute video. Then, when you’re ready to build your own, download Matomo On-Premise for free or start your 21-day free trial of Matomo Cloud — no credit card required.


